Walk the extra mile: How to make climate services more inclusive?

Summary
The lack of local weather and climate information in remote rural areas complicates adaptation strategies to climate extremes for the concerned communities. Climandes – a cooperation project between the Peruvian and Swiss weather services Senamhi and MeteoSwiss – developed an approach to systematically integrate small-scale farmers in the Andean highlands into the design and delivery of climate services. This paper outlines the project’s approach and presents key findings and lessons learnt.
2016 was marked by one of the strongest El Niño events on record, affecting more than 60 million people worldwide and calling for USD 3.6 billion in humanitarian aid. In the same year, the number of chronically undernourished people in the world increased to 815 million, which represents a first rise after a long lasting downward trend. Besides political instability, the El Niño-driven weather patterns were the key drivers for this intensification of global food insecurity.
What makes the 2016 El Niño noteworthy is that a forecast of the event was available with significant lead times, yet this critical information was not known, accessed or understood by a large part of agricultural communities living in remote rural areas in low- and middle-income countries. This is all the more significant in view of the fact that these population groups are particularly vulnerable to weather and climate events as their livelihoods heavily depend on climate-sensitive agricultural production. Community-based climate services – that is user-tailored weather and climate information overlaid with agronomic expertise and co-developed with the target population – serve as a critical aid for decision-making to adapt to such extreme climate conditions.
The Climandes approach
In the framework of the Climandes project, we developed a two-stage approach to design evidence-based climate services with an active and early involvement of people and communities in the agricultural sector. Our evaluation results and project outcomes indicate that the user engagement fostered a strong increase of trust in the weather service Senamhi and in the information provided.
In the publication* Designing user-driven climate services we share our practical experiences of the project implementation providing guidance for similar initiatives in low- and middle-income countries. It represents a systematic description of key steps that proved to be indispensable for the implementation of meaningful and sustainable climate services tailored to the needs of agricultural communities. By focusing particularly on the last mile to reach the most vulnerable and marginalized population groups, we strive to make climate services more inclusive.
The applied approach reported in this publication (see full text) is generic and transferable to other region and climate-sensitive sectors.
*download from the right-hand column or via the links below. Some key messages and a checklist for practitioners developing climate services are provided below. See the full text for much more detail.

Lessons Learnt
- A key finding is that for a climate service to be user-driven, it needs to be developed based on evidence gained from social, economic and natural sciences and by applying participative research and implementation approaches.
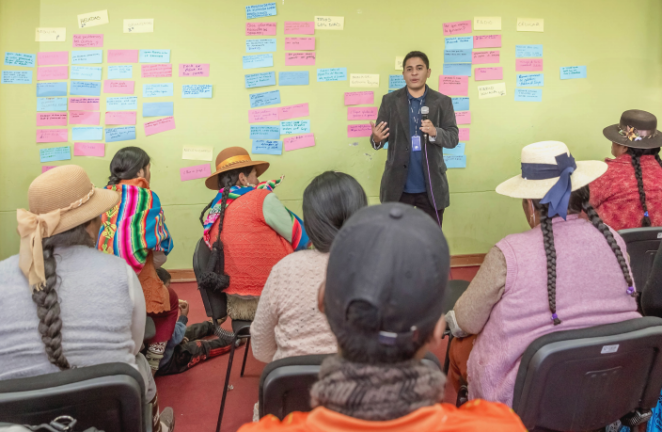
- To be effective, the design of climate services requires the active involvement of people and communities. To make sure their voices are heard and climate services are relevant to their needs, we propose a two stage approach for developing a pilot User Interface Platform implementation. The first stage provides robust evidence required to plan the intervention. The second stage involves a series of climate field workshops accompanied by monitoring and evaluation activities.
- Even if climate services are available, they often fail to provide the information in a way that is meaningful to end-users. In this case, the adoption of this information and integration into decision-making appears to be compromised by a lack of acceptance, accessibility, comprehension and accuracy. In the case presented here, user participation through climate field workshops and community outreach led to a greater credibility of the national meteorological service, a more positive perception of the accuracy of the information provided and enhanced consideration in daily production activities. The way each barrier was address is described on page 16.
- This case provides a proof-of-concept that the GFCS User Interface Platform is a suitable vehicle to bridge the gap between the weather and climate information user and provider communities. In this work the User Interface Platform (UIP) was probably the single most decisive factor in successfully bridging the supplier-user gap.
- The implementation of a UIP based on community outreach is resource-intensive and requires enhanced capacities of technical staff in meteorological offices in peripheral regions. Particular attention must therefore be paid to the decentralization of meteorological services in the implementation countries.
- Filling scientific, technical and operational gaps on the provider side is also key. Climandes put particular emphasis on improving the quality of observational data because spatially and temporally complete, high resolution climate data are required for climate services to be reliable.
- The twinning approach chosen for the Climandes project implementation was a recipe for success regarding the development of capacities in the climate and user communities. All activities were developed through a partnering collaboration between the regional and national offices of Senamhi Peru and MeteoSwiss, and can be seen as an effective peer-to-peer, on-the-job training as well as a means of building personal professional networks.
Checklist for the design of user-driven climate services
Based on our expertise gained in the Climandes project, we provide a checklist for the proposed two–stage approach to designing user-driven climate services. This approach has been piloted in the agricultural sector but can be applied to other sectors as well in a generic way. These stages encompass an accurate assessment of the implementation context (setting the scene by providing evidence), base the implementation processes on this assessment (establishing a userdriven climate service prototype) and ultimately, an operationalizing and upscaling of the implementation to a wider region (striving for sustainability):
- Stage 1 =Setting the scene by providing evidence
- Stage 2 = Establishing a user-driven climate service prototype
This checklist is provided within a framework on page 21 of the full text. See below for the checklist in text.
User community participation
- Stage 1:
- Identify and evaluate key stakeholders and users relevant for climate services (stakeholder mapping)
- Assess socio-economic vulnerability of the target population including the characterization of key hazards (exposure & sensitivity) as well as socio-economic characteristics (adaptive & coping capacities)
- Identify vulnerability factors such as gender, socio-economic status, income inequalities, etc.
- Stage 2:
- Establish a continuous interaction mechanism e.g. through workshops targeted to directly address the identified constraints to the use of weather and climate information
- Improve the climate literacy of the target users
Tailored information and communication
- Stage 1:
- Identify key constraints to utilization of weather and climate information
- Assess cultural aspects regarding climate service utilization (e.g. indigenous knowledge, Local traditional knowledge)
- Understand how target population can be reached (e.g. radio stations, mobile phone distribution)
- Stage 2:
- Develop a distribution strategy
- Establish information tailored to the users and delivered through identified distribution systems
- Establish a feedback mechanism to verify that forecasts and warnings are received and understood with the aim to continuously improve the service
Provider capacities
- Stage 1:
- Identify scientific, technical and operational gaps regarding climate service provision (e.g. low station density, lack of technical capacities, insufficient data and product quality, missing human resources at peripheral level)
- Stage 2:
- Rectify the scientific, technical and operational gaps on the provider side to improve data and product quality
- Increase awareness in the climate community to ensure appropriate consideration of user needs for climate data and products
Policy Dialogue
- Stage 1:
- Evaluate potential socio-economic benefits of planned climate service to facilitate policy engagement
- Implement a monitoring & evaluation process to measure the impact of the intervention
- Stage 2:
- Hold a policy dialogue with local, regional and national policy-makers to help them understand the return on their current and future investments in climate services
Striving for sustainability
- Bring all developed services to operation
- Upscale the prototype service to a wider user community
- Share lessons learnt and key experiences with other organizations and practitioners


Comments
There is no content